
A production line rated at a given output rarely achieves it over a full shift. A gap of ten or fifteen per cent between the theoretical rate and the actual figure is common, and often accepted as normal.
The gap is usually not caused by one large problem. It is the sum of several small ones, most of which are not recorded anywhere, because nothing stopped for long enough to be logged as downtime.
Below are seven causes worth checking, in the order they are usually worth checking them. Each includes a practical way to test whether it applies to your line.
1. The line is rated on its fastest machine, not its slowest
A line runs at the pace of its slowest operation. If the stated rate came from the filler or the case packer, and the slowest operation is somewhere else, the target was never achievable.
This sounds obvious, but the rated figure is often set at commissioning and never revised, while equipment has been added, replaced or moved since.
How to check: Time each operation separately over ten minutes at full running. The slowest one is the line rate. Compare it with the figure being used for planning.
2. Micro-stoppages that are never recorded
A stoppage of thirty seconds is usually cleared by the nearest operator and not reported. Twenty of them a shift is ten minutes of lost output, and they tend to recur in the same three or four places.
Because none of them is individually significant, they do not appear in a downtime report, and the cumulative effect is invisible.
How to check: Ask an operator, not a report, where the line stops most often. They will name the same two or three positions consistently.
3. Output falls across the shift
Where any part of the line depends on manual pace, output is highest in the first hour and lowest in the last. The decline is gradual and rarely measured.
This is most pronounced on physically demanding tasks. Manual case handling, stacking and loading all slow measurably as a shift progresses, and the effect compounds where overtime is being worked.
How to check: Compare output for the first hour of a shift with the last hour, over a week. A difference of more than a few per cent indicates a manual pace constraint.
4. Changeover takes longer than it appears to
Changeover is usually timed from when the line stops to when it restarts. That measurement excludes the ramp-up period afterwards, during which output is below rate and reject levels are higher.
Where a changeover involves reprogramming or reconfiguring equipment, and particularly where it requires a specialist rather than the operators on shift, the real cost is considerably higher than the recorded stop time.
How to check: Time from the last good unit before changeover to the point where output returns to full rate. Compare that with the recorded changeover time.
5. Staffing gaps in specific roles
Most lines can absorb one absence. The exception is a role that is physically demanding, hard to recruit for, or requires people to be in a particular place continuously.
When one of those roles is short, the line either slows to match or someone works harder to cover it. The first outcome is lost output; the second is a health and safety exposure that appears later as absence or a claim.
How to check: Identify which roles are covered by agency staff, and which have the highest turnover. Those are the constraints.
6. Rework caused further upstream
Product that has to be restacked, relabelled or re-wrapped consumes capacity twice. The cost is normally recorded against the point where the problem is found, not the point where it was caused.
Pallet quality is a frequent example. An unevenly stacked or out-of-square pallet may pass at the end of the line, then be rejected at a customer’s delivery point or arrive damaged, and neither outcome appears in the line’s own figures.
How to check: Ask the warehouse and transport teams what they most often have to correct. It will rarely be the same answer production gives.
7. The end of the line sets the pace of everything before it
This is the one most often missed, because it does not look like a bottleneck. Nothing breaks and nothing stops.
If product accumulates at the end of the line faster than it can be stacked and moved, the line is eventually held back to match. That constraint is applied gradually, through operators easing the pace or a conveyor backing up, and it is not recorded as downtime because the line never actually stopped.
End of line is also where the product is at its heaviest and where the whole line converges, so it is the point most sensitive to manual pace, absence and fatigue — the causes described in points three and five above.
How to check: Watch the end of the line for twenty minutes at full running. If product is accumulating, or if anyone upstream is moderating pace to prevent it accumulating, that is the constraint.
What to do with the answers
Most of these are addressed without capital expenditure. Revising a rated figure, recording micro-stoppages properly, timing changeover honestly and asking the warehouse what it corrects are all matters of measurement and attention.
Three of them — declining output across a shift, staffing gaps in physically demanding roles, and accumulation at the end of the line — tend to share a single cause, which is that some part of the process is limited by how fast people can lift.
Where that is the case, end-of-line automation is usually the appropriate response, and it is normally the least disruptive place to start because a palletising cell sits at the end of the process rather than within it. We have set out where to begin, and what to get right, in what to automate first. The manual handling case is covered separately in manual handling risks in palletising.
If none of those three applies to your line, the answer is somewhere in the first four points, and it will cost you nothing but the measurement.
If you are interested in Automated Palletising to help improve your output
We will visit your site free of charge, look at the end of your line and tell you whether automated palletising is worth considering and what your likely payback would be.
Contact us on 01223 499488 to book a free site visit or use our palletiser savings estimator to calculate what you could save with an automated palletiser.
Watch automation videos…

Find out more…
- Is Your Warehouse Slowing Down? How to Spot Hidden Bottlenecks in Packing and Shipping
- The Granta Advantage: KUKA Platinum Status + Patented Software = Smarter Automated Palletising
- Why Granta Palletisers are the Preferred Choice for Contract Packers
- 5 Ways Automation Can Solve the UK’s Manufacturing Labour Shortage
- The Compact Palletiser: Big Performance in a Small Footprint
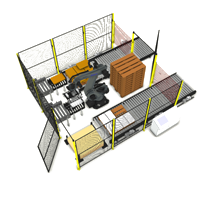 Bag Palletiser
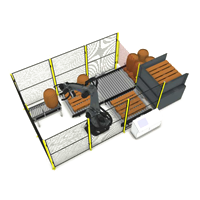 Barrel Palletiser
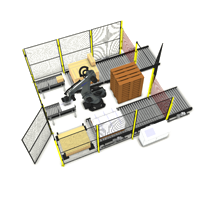 Box Palletiser
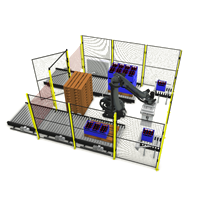 Crate Palletiser
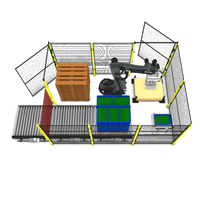 Tray Palletiser